

Value for Money reporting
Value for Money reporting
Features of a good report, and strategies for structuring it

As an evaluation capability-builder I’m often invited to provide peer review or quality assurance of draft value for investment (VfI) reports. So I thought I’d share what I look for in a report, including my views about what makes a good VfI report.
VfI is an approach to value for money (VfM) assessment that combines theory and practice from evaluation and economics. It’s underpinned by evaluative reasoning (usually rubric-assisted), mixed methods, and collaborative power-sharing with those impacted. So when I’m reviewing a VfI report, I’m looking for evidence of these guiding principles being applied.
In a more concrete sense, I want to see a report that:
gets straight to the point and answers the key evaluation questions
shows its working, providing warranted value judgements supported by evidence and logical argument
isn’t torture to read.
Together, these features help to make an evaluation report valid, credible and useful.
A simple formula
A guideline I typically apply to my own report-writing and recommend to those I mentor is:
spoilers at the front
working in the middle
detail at the back.
Applying this approach helps to frame up a logical, readable report. As an added bonus, it also helps make it easier to write! Read on to find out how…
1. Spoilers at the front
A good VfI report is the opposite of a good joke, because it gives away the punchline at the very start (also, ideally people don’t laugh at it). My aim is to provide an executive summary that stands on its own and provides enough detail for most readers, in as few pages as possible.
For example, an approach I often use is to include a table in the executive summary that summarises evaluative judgements for each of the VfI criteria, a brief summary of the supporting evidence, and perhaps any key lessons, opportunities or other considerations that might assist in decision-making about next steps.

A couple of reminders about this approach: First, the example above shows the 5Es as the VfI criteria. I argue that the 5Es aren’t the definitive criteria of good resource use. Criteria should be contextually defined with stakeholders, not prescribed. However, the 5Es are a reasonable checklist for an initial conversation about what good use of resources might look like in a context, and can often be defined in program-specific ways that collectively define what good resource use looks like to an adequate degree.
Second, the judgements shown in this example use terms like ‘excellent’ and ‘good’ (and could also have included ‘adequate’ or ‘poor’). When evaluative judgements are based on agreed definitions co-developed with stakeholders, these terms are not merely superlatives - they have a precise, agreed meaning within the context of the evaluation. And of course, you don’t have to use these particular terms. You can define a set of standards appropriate for your evaluation needs.
2. Working in the middle
This is the body of the report, where we lay out succinct answers to key evaluation questions and make our reasoning transparent and traceable. The key principle governing this section is that it is organised around the things that matter to stakeholders (and not, for example, the methods or sources of evidence used in the evaluation).
In other words, the organising structure is determined by the key evaluation questions (KEQs), often as chapter headings, and the criteria used to answer each question, often as the main sub-headings.
For example, in a VfI evaluation, there may be three KEQs along the lines of:
To whom and in what ways is the investment valuable, and how does it create value? (A question that we can answer by describing and validating a theory of value creation)
To what extent does the investment provide good value for the resources invested? (A summative question that we can answer by applying the general logic of evaluation - using agreed criteria and standards to make judgements from evidence)
What opportunities exist to provide greater value from the investment? (A formative question that is also addressed, at least in part, by considering strengths and weaknesses against the same rubrics used in question 2).
Of course, the KEQs are different each time, but they often look a bit like these. If an evaluation addresses these three KEQs, then we could report the findings in three chapters, one for each KEQ. And within the chapter addressing KEQ 2, we could organise the findings by criteria. For example, if using the 5Es, we could structure the findings around sub-headings of Economy, Efficiency, Effectiveness, Cost-effectiveness, and Equity.
Within each of the five sub-sections, we could provide our program-specific definition of the relevant criterion, the rubric setting out the agreed basis for judging performance, our judgement, and a summary of the key pieces of evidence that support the judgement, including triangulation of evidence from multiple sources. For example:

The overriding objective of this section is to make our reasoning explicit, and to provide only the information that is necessary and sufficient to do so.
3. Detail at the back
This is the section that’s likely to have the highest page count, usually well over half the report and sometimes 90% or more, but will be the least-read. If the spoilers at the front and working in the middle do their jobs well, most people won’t read all of the detail at the back, but they might refer to specific sections that interest them, or follow up some cross-references in the body of the text, and it’s important for the credibility and validity of the report that they’re able to do so.
I find it often works well to organise this section as a series of annexes, each focusing on a different stream of evidence. As I’ll come back to later, these are the parts of the report that get written first, and different writers may contribute different annexes. This allows for multiple write-ups to happen in parallel, while also being structured in a logical way for detail-minded readers.

A couple of examples
While every report is different, these two publicly-available reports provide examples of how we’ve applied these principles in practice. You’ll also notice that neither of these reports used the 5Es as criteria, though the influence of the 5Es in scoping and shaping the criteria is evident in the first example.
Youth Primary Care Mental Health Initiative
This evaluation report, detailed in a previous post, included:
Spoilers: A four-page executive summary plus a summary table of evaluative judgements with rationale (6% of the report)
Working: A 27-page body of text, organised by KEQs and criteria (19% of the report)
Detail: Annexes totalling 88 pages, organised by evidence source plus the full set of rubrics (62% of the report)
The remaining 13% of the report included the introduction, summary of methods, and glossary.

Social and economic impact assessment of a multi-country collaboration on radiotherapy
This report included:
Spoilers: A two-page executive summary, including evaluative judgements in the final paragraph (3% of the report)
Working: A five-page summary of key findings (7% of the report)
Detail: Annexes totalling 65 pages, organised by evidence source plus methodology and references (87% of the report)
The remaining 3% of the report included the introduction and methods, and a glossary of acronyms.

Some observations
Features of this approach to reporting include:
It’s our evaluation journey, backwards
Take a look at the table of contents above, and read it from bottom to top. We started by doing our homework on the program, developing criteria and standards, and determining what evidence would be needed and what mix of methods would be appropriate (Annex G). Then we gathered and analysed evidence to address the criteria, and wrote up the findings from each evidence source (the detail: Annexes A-F). Then we wrote a concise summary of the judgements and the most important pieces of evidence (the working: pages 5-9). Finally, we wrote the executive summary (spoilers: page 1) and the other introductory sections (pages 3-4).
Typically the process of making judgements includes a collaborative sense-making process with stakeholders. For example, we often prepare a PowerPoint summary of top-line findings and present these to stakeholders as conversation-starters. Through this process stakeholders may validate, contextualise, and/or challenge our preliminary findings. Creating, presenting, and discussing the PowerPoint presentation is excellent preparation for writing up the working in the middle and spoilers at the front, because the report is to a large extent a written summary of the presentation.
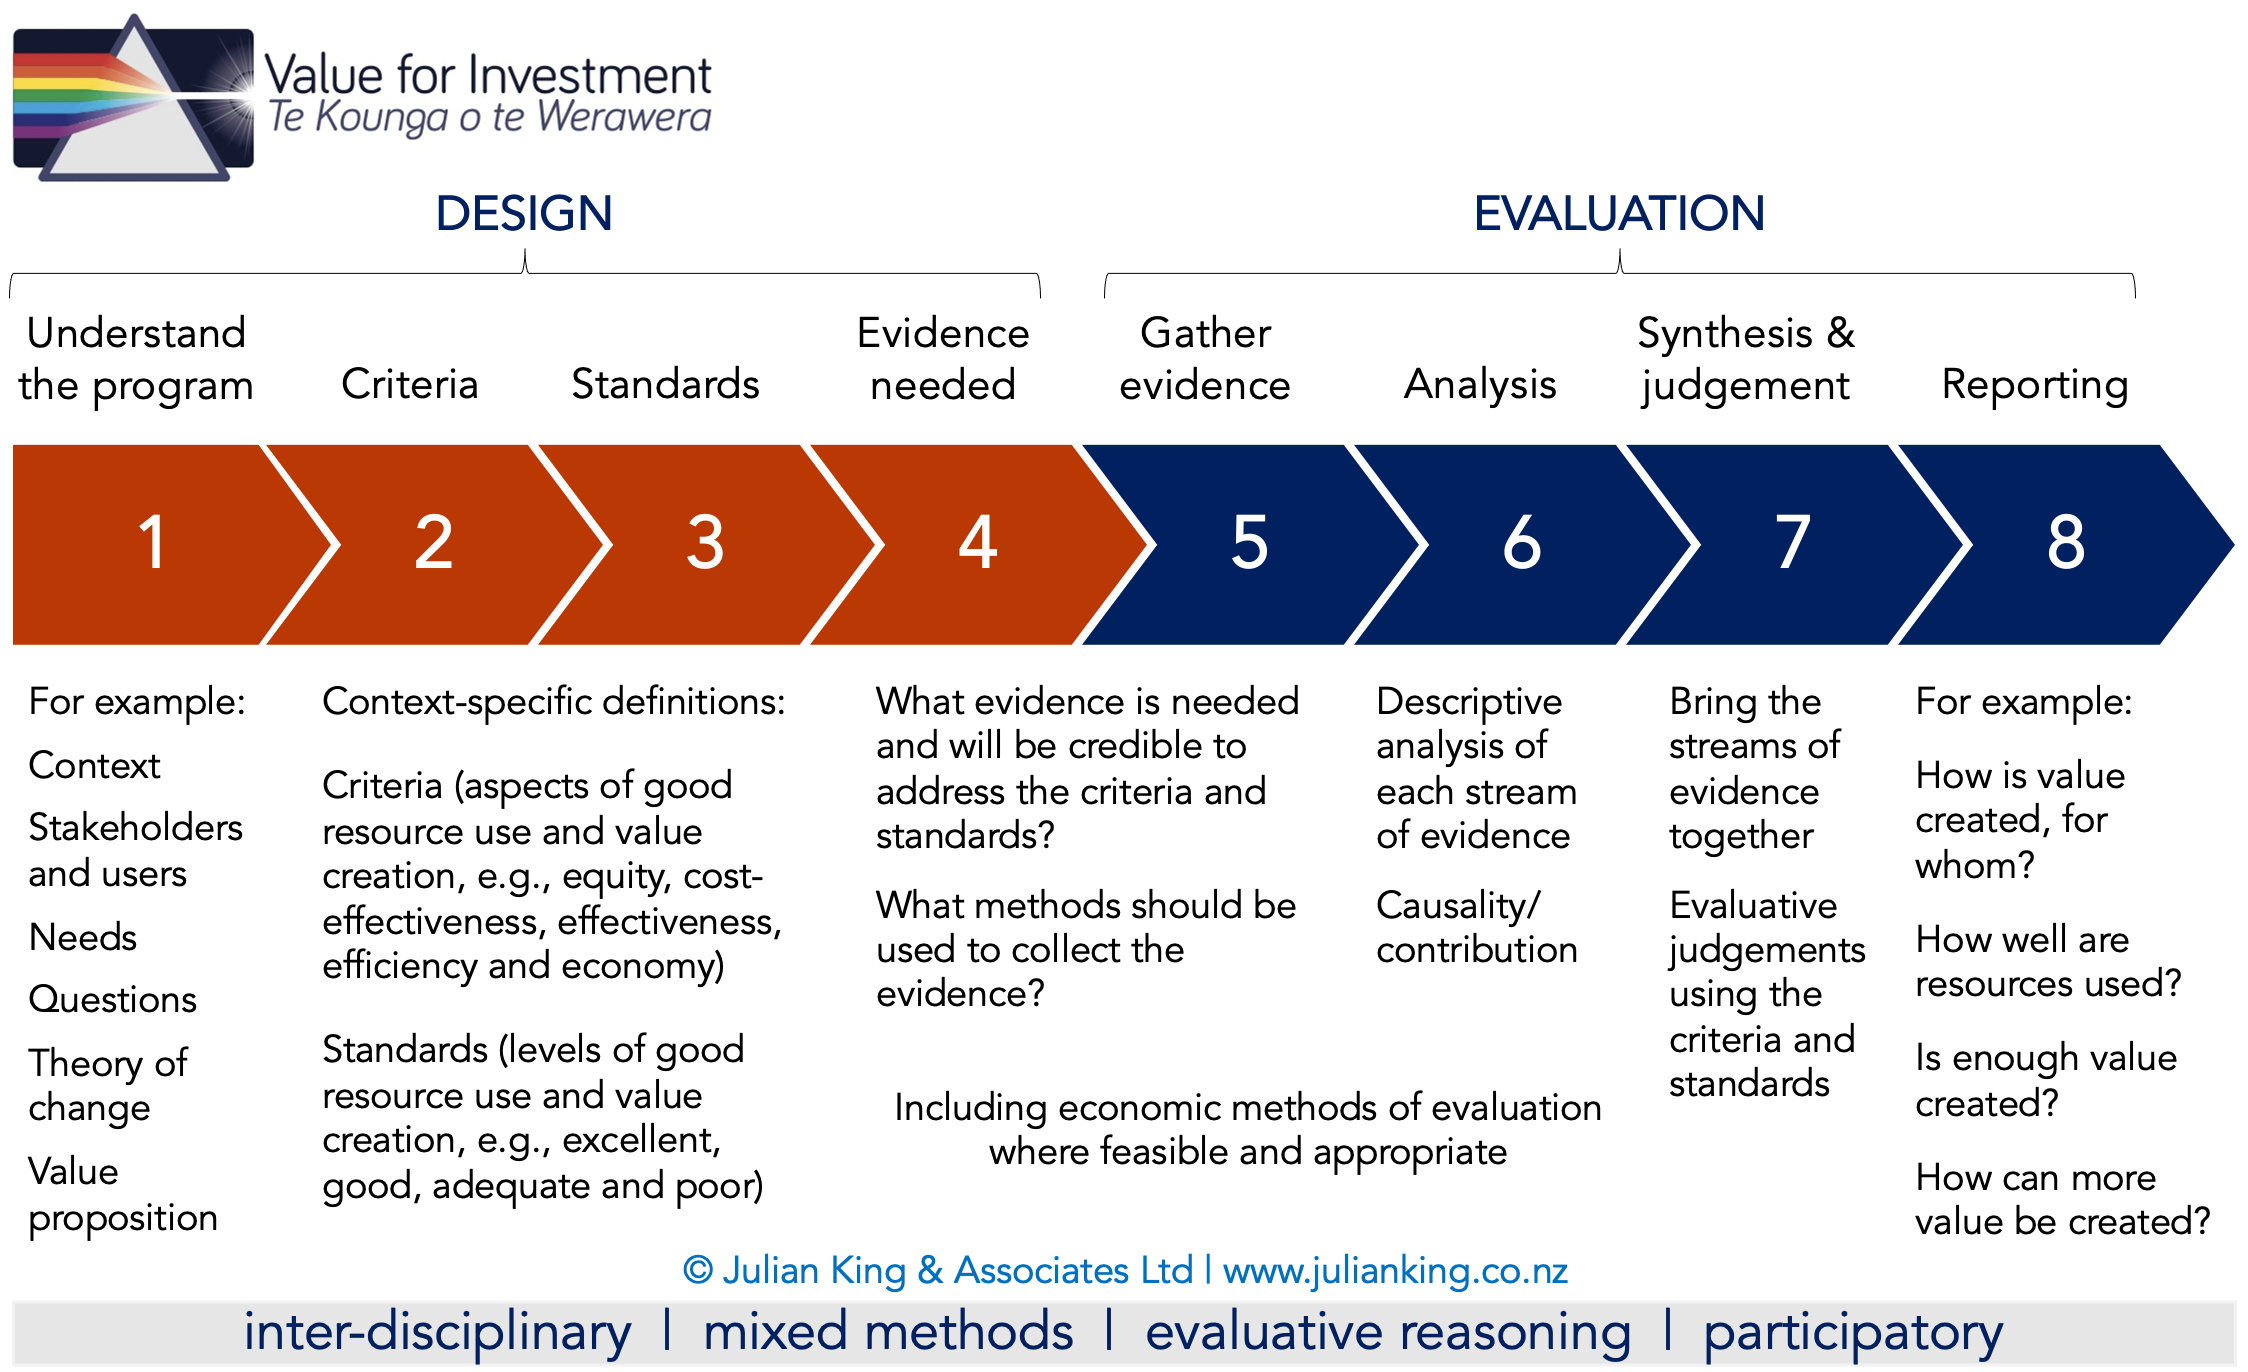
The VfI approach follows this familiar sequence of steps, shown below. This is how we get all the way from clear questions to clear answers. Though the diagram may give the appearance of a linear process, in reality it’s a long and winding road, and we walked it so that our readers wouldn’t have to. So we write the report backwards. From the reader’s perspective, our report starts with the answers, and then provides a thread that the interested reader can pull to see how we got there.
It addresses the things that matter
The criteria are quite literally the ‘things that matter’. They are the agreed aspects of performance, co-constructed with stakeholders, that collectively define what value looks like for the investment.
Since the criteria are an expression of what matters, they double as a guide to what should be in or out of scope. If something matters, it should be reflected in the criteria. If something isn’t in the criteria, why include it in the evaluation? (There may well be extra background information that you decide to include in the report even though it doesn’t directly address any of the criteria, but it’s worth pausing to consider this question).
And after having gone to all that work to negotiate and agree what matters, why on earth would we structure the report around anything else? This is why the ‘spoilers at the front’ and the ‘working in the middle’, are structured in a way that explicitly and systematically address the criteria.
The rubrics provide the structure
The rubrics are the backbone for this whole process. Developing criteria (step 2) and standards (step 3) ensures that the evaluation is aligned with the program, including its context, theory of change and value proposition (step 1), that it gathers and analyses the appropriate evidence (steps 4-6), makes sense of the evidence on an agreed basis (step 7) and reports clear answers to evaluative questions (step 8).
The rubrics also provide organising structure within each step. For example, data collection tools such as interview schedules and survey questions each map back to the content of the rubrics. And if you examine the Annexes from the two report examples linked above, you’ll see that each Annex is structured according to the relevant criteria they address.
The logic of the rubrics should be traceable throughout the report. It should be clear how the findings map back to the criteria, standards and evidence. It should be clear how the criteria map back to the theory of change and value proposition. It should be clear how the criteria address the key evaluation question. Using consistent terminologies, in a consistent sequence, provides clarity for authors and readers alike.
The reasoning is traceable
This style of reporting, in my opinion, models the general logic of evaluation for our audiences. It:
Poses clear evaluative questions and provides clear answers
Defines what aspects of performance and value matter (criteria)
Defines what good looks like (standards)
Justifies methods selection through a clear line of sight back to the criteria and standards
Presents mixed methods evidence in a way that directly and systematically addresses the criteria
Provides explicit judgements linked to the criteria, standards and evidence.
The full details of the criteria, standards and evidence are discoverable within the report, while each reader’s journey of discovery can be short, medium or long as they wish - but never as long as the journey we evaluators had to take to provide the report.
Easily pulled apart for adaptation and dissemination
The two report examples above are 142 and 75 pages respectively, fairly representative of the range of report sizes that often result from this approach. These reports are versions of what Chris Lysy calls the “comprehensive technical report”. It may carry the label “final evaluation report” but it’s just the starting point when it comes to disseminating findings.
Under the ‘spoilers-working-detail’ approach, these comprehensive technical reports already fall into three parts (short, medium, and long), giving us a headstart when it comes to tailoring content for different audiences.
For example:
Three versions of the report could easily be prepared from the existing content, such as: 1) executive summary only; 2) executive summary plus introduction, methods and working; 3) technical annexes
The executive summary could be adapted into a web page with hyperlinks to more information
The summary table of evaluative judgements could be beautified for incorporation within an infographic or dashboard
The ‘working in the middle’ could be summarised in a more visually appealing format such as a Duarte SlideDoc.
These are just examples to illustrate. Each case is different. Follow Chris Lysy for go-to expertise on communicating findings to boost engagement and impact of your work.
A few extra points
Start with the end in mind. Before you start writing, identify your audiences and prepare a dissemination strategy. Chris Lysy for that too!
Reporting is telling a story. It’s a true story but that doesn’t mean it has to be boring. Make it compete for my attention.
Provide the information in a logical order. For example, in order for the evaluation findings to make sense, it’s usually necessary to provide some introductory background on the program, the context, the evaluation needs, etc.
Check your reasoning. Are you backing up your claims? If you say the program ‘caused’ or ‘contributed to’ a change, have you explained why? If you say a result is ‘good’, have you justified why? If you say something is ‘already well known’, have you provided references? Imagine I’m sitting on your shoulder like an annoying parrot, saying:
Write to the rubrics: use the rubric text as the starting point for the opening sentences in the 'working in the middle’. For example, if a rubric defines excellent outcomes as: “The programme meets all, and may exceed some, of its intended intermediate outcomes”; and you judge that the programme meets the definition of excellent, you can report that: “The programme met all of its intended outcomes and exceeded some expectations”. (You would then proceed to describe which outcomes, how they were met or exceeded, and how you know).
Use lower-level sub-headings to break up the text and help tell the story. For example, in the Youth Primary Care Mental Health evaluation I like the way the Dovetail team used sub-headings to report findings like “Some flexibility was evident in the procurement process, but this was undermined by short timeframes and scale of responses required” (p. 28). It signposts what to take home from the paragraphs in that sub-section and helps readers to scan the content and identify the areas they want to dive into.
Graphs and tables help to tell the story. Use them well. Stephanie Evergreen for that. Also look out for this brand new resource, The Data Storyteller’s Handbook by NZ author Kat Greenbrook. Describe in the text what you want the reader to notice when they look at the data vis. Format the data vis to make the important details stand out. Describe in the caption what you want the reader to take home. In short, minimise my cognitive load.
Run a spelling and grammar check! Errors are distracting and, whether it’s fair or not, can erode the credibility of the report. Don’t assume I understand acronyms or insider jargon. Explain them to me.
I’ll stop there
Let me know your thoughts. Is this similar to the way you write reports or the things you look for when you review them? What did I forget? Thanks, as always, for engaging!
Thanks for sharing this timely material, Julian. I especially like the way you focus on sharing the most important messages up front, and organising it around agreed statements of what is most important. I still find that far too many evaluation reports present relatively undigested data and then disconnected conclusions.