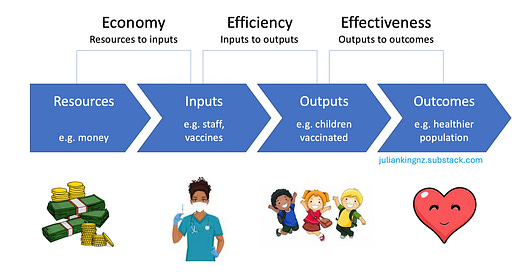
When it comes to assessing value for money (VfM), simple ratios like average cost per unit of output or outcome are appealing. These indicators are relevant to VfM and seem to promise “objectivity” and comparability. Sometimes they deliver. But to be useful they have to pass some hurdles for feasibility, quality and interpretability, without which they are more likely to mislead than inform decisions.
So, how can you tell when they’re likely to contribute meaningfully to a VfM evaluation?
The allure - and limits - of ratios
Ratios are a valid way of conceptualising efficiency-related aspects of VfM. The notion of maximising productivity at each step of a value chain - converting resources into inputs, inputs into outputs, and outputs into outcomes - is explicit in the three Es of economy, efficiency, and effectiveness.
Imagine a fairly straightforward intervention, like a vaccination program. We have a fixed budget of resources with which to buy vaccines, staff and other inputs, to reach our target group and maximise the number of children vaccinated (outputs), with an expectation that doing so will contribute to a healthier population (outcome).
We can produce ratios at each level of this value chain, such as:
Economy: average cost per vaccinator per year (resources to inputs)
Efficiency: average number of vaccinations administered by each vaccinator (inputs to outputs)
Effectiveness: average reduction in notified infections per 100,000 children vaccinated (outputs to outcomes).
We can also produce ratios that span wider sections of the results chain, such as:
Cost-efficiency: average cost per child vaccinated (resources to outputs)
Cost-effectiveness: average cost per notified infection avoided (resources to outcomes).
These ratios are likely to be useful in several ways. They help us to understand what it actually costs to provide the vaccination program. These ratios (and other breakdowns such as fixed and variable costs) can help inform future budgeting and, with a bit of extra analysis, scaling decisions. If we track ratios over time, they could help us understand how our productivity is increasing or decreasing at different levels of the value chain.
Perhaps we can even use these ratios to evaluate whether our vaccination program is providing good VfM. In principle that’s a good idea. In practice, it is often challenging. Unless the right conditions are met, the ratios we produce and the comparisons we make may rest on bold assumptions and, without context, may mean very little. Let’s explore some key challenges.
The attribution challenge: from costs to impact
To calculate meaningful ratios, we need to be able to match costs accurately to specific outputs or outcomes. This may be straightforward for identifying the costs of some inputs (e.g., salaries, equipment, materials) if accounting systems provide clear data. But as we move along the value chain, things get murkier:
Attributing costs to outputs requires determining how much time and how many resources were devoted to each output. This often involves some estimation - e.g., collecting activity data for a few weeks, or making assumptions or educated guesses about how much time staff members spent on different outputs.
Attributing costs to outcomes is even more challenging. For starters you need to be collecting data on outcomes (I know it sounds obvious but it doesn’t always happen). Then you must establish a credible causal link between program activities and outcomes. And on top of that, you must quantify the degree of contribution - e.g., a percentage - to attribute to the costs of a defined set of activities. This attribution is often uncertain and may oversimplify the reality, especially when outcomes result from the interplay of multiple actions and external influences. Cost-per-outcome ratios can also depend on the time frame covered by the analysis and whether it is long enough to capture delayed or long-term effects.
The further we move from direct inputs toward long-term impacts, the more our ratios depend on assumptions, estimation and modelling rather than on concrete, verifiable data. Consequently it becomes important to test how results change with key assumptions or uncertainties (e.g., through sensitivity and scenario analysis).
The challenges are compounded in more complex programs that evolve over time, feature a greater variety of inputs, outputs and outcomes, and involve intricate ‘many-to-many’ interactions between them rather than simple one-to-one (e.g., one action to one outcome) relationships. As complexity increases, the reductionism required to produce ratios becomes increasingly problematic - sometimes to the point of absurdity - because these metrics can obscure essential nuances like adaptive ways of working and interdependencies between components. As a practical matter, the added complexity also raises the risk of over/underestimating, double-counting or omitting costs or outcome contributions, further distorting results. In these contexts, it becomes exceedingly difficult to produce meaningful and reliable ratios, and there’s a real danger that these ratios may mislead rather than inform.
Bespoke outputs: when are ratios meaningful?
A vaccination program produces a straightforward, relatively uniform, countable output: number of vaccines administered. However, many programs produce heterogeneous outputs that are tailored to meet specific needs - for example:
Research programs, which produce outputs like reports, policy briefs, or scientific articles - each with different topics, methodologies, and findings.
Consultancy projects, where deliverables may include customised recommendations, feasibility studies, or strategic plans, all tailored to specific client needs.
Governance facilities, which generate outputs such as policy frameworks, regulatory guidelines, topical reports, and ad hoc policy advice to meet circumstantial needs.
Social services, such as case management for vulnerable populations, where outputs are individualised support plans or interventions, differing for each client.
Legal aid programs, producing outputs like legal opinions, case files, or court submissions, each unique to the client and situation.
Educational programs, especially in special education, where individualised education plans are developed for each student, reflecting their specific needs and goals.
In some of these cases, it may be possible to estimate ranges of meaningful ratios. For example, even though each social service client’s needs are different, we might find that the cost per client is normally distributed around a stable mean. This could also be the case with examples like legal aid and special education. Separate ratios could also be produced for different subgroups.
On the other hand, programs producing a smaller number of bespoke outputs may not follow a regular pattern, with cost ratios depending on the unique nature of each output. For example, we may not be able to produce a meaningful average cost per output for research, consultancy and governance services.
The benchmarking problem: numbers need context
Ratios, like average cost per output or outcome, can potentially be useful indicators in VfM evaluation. But a ratio is just a number unless we have some basis for judging whether it is ‘good’.
To interpret whether a ratio is ‘good’, we can look for suitable benchmarks such as industry standards,1 or ratios from similar programs, giving us external points of comparison with our program. For example, perhaps we can identify other successful programs working with similar populations in similar contexts in pursuit of similar outcomes, and compare our program with those others.
Finding valid comparators is challenging enough; accessing their data can be even harder. In my experience it is vanishingly rare for a comparator program to willingly share its financial data (or to have the right ratios to hand over). Moreover, if we want to compare ratios across programs or over time, we need:
Consistent measurement: Are the different programs using the same data definitions and methods to calculate the ratios? Do the structures of their respective accounting systems permit like-with-like comparisons?
Consistent contexts: Are the projects truly comparable, or are there important contextual differences in target populations, local costs, delivery models, and other factors that would make comparisons misleading?
As there are always differences in context, it becomes necessary not only to produce ratios for our program and its comparators, but to systematically identify contextual differences and assess (quantitatively or qualitatively) how they might impact on the comparison.
In the absence of external comparators, we can still undertake comparisons that are internal to a program, such as trend analysis to see whether ratios are changing over time, or comparison with performance targets. These, too, need to be interpreted cautiously because trends can reflect external factors rather than actual program performance, and performance targets may be based on unrealistic assumptions.
Monetising benefits: promise vs practice
Putting monetary valuations on benefits and costs means they can be directly compared to see whether a program creates more value than it consumes. An advantage of this approach is that it doesn’t require comparison with another program; if benefits exceed costs, then we can deem the program worthwhile. However, it is also possible to compare different programs with each other, to see which ones create the most value.
Cost-benefit analysis (CBA) and social return on investment (SROI) both produce benefit-cost ratios (BCRs) and other indicators that explore the relationship between monetised costs and benefits. However, the design of each CBA or SROI involves a multitude of analyst decisions (such as scope, perspective, time horizon, and discount rate) that affect results. On top of that, there are many ways to estimate monetary values of different impacts, leading to potentially wide differences between studies. Even when monetary valuations appear standardised, real-world comparisons between projects can be more problematic than they seem. Differences in methods, data, study populations, and the types of impacts included (or omitted) mean that direct comparison between studies requires careful scrutiny.2
Comparisons are most likely to be valid when the different analyses were conducted using a consistent approach, at the same time and location, and for qualitatively similar programs. The further analyses diverge from these ideal conditions, the more caution is needed in interpreting and comparing their results.
QALYs: facilitating valid comparisons of healthcare interventions
Quality-adjusted life years (QALYs) offer a more standardised approach, at least for comparing the costs and consequences of health interventions. QALYs combine quality and quantity of life into a single metric (without attempting to include other aspects of welfare). They estimate population preferences for different health states and provide a standardised utility measure, enabling comparisons of diverse health programs, diseases, and interventions on a common scale.3
Ratios of costs per QALY are widely used to facilitate comparisons between interventions and guide resource allocation decisions in healthcare - indeed, comparisons are required to make cost-utility ratios meaningful. Caution is still advised. For example, costings may differ in scope and methods. Programs may differ in study populations and health states. There may be outcomes not captured within the studies. There may be differences in data sources, modelling approaches, and ethical considerations (e.g., potential under-valuation of treatments for the elderly or people with disabilities). QALYs were developed for, and are mainly used in healthcare, and their applicability is more limited and less established outside of this domain.
There’s more to VfM than just efficiency
Cost-per-output and cost-per-outcome, if they tell you anything, tell you something about efficiency. But there’s more to VfM than just efficiency. For example, equity, relevance, affordability, sustainability and other criteria are often important aspects of good resource use - and there may be trade-offs between different criteria.
Making gains in equity may involve trade-offs against efficiency. For example, vaccinating communities that are geographically hard to reach, or suspicious about vaccination, may be more costly than average per person vaccinated. It is also important to consider which costs, outputs and outcomes are relevant to which stakeholders, as VfM can look different from different viewpoints.
This isn’t an objection to the use of ratios, but a reminder that ratios alone aren’t enough. Ratios can be useful under certain conditions, but they are neither necessary nor sufficient for good VfM evaluation.
Conclusion: use ratios wisely
Ratios can be valid indicators in VfM assessment, but only under the right conditions and if used with care. They are most likely to be worthwhile when:
The data available for costs, inputs, outputs, and outcomes are robust, reliable and sufficiently granular
Costs can be clearly attributed to outputs or outcomes
Outputs or outcomes are relatively homogeneous and stable
Valid benchmarks or comparator data are available
Measurements are consistently performed across the intervention and its comparators
Contextual differences are accounted for
Trade-offs against other criteria (such as equity) are considered.
That’s a stringent set of conditions to meet. But without them, ratios risk becoming an exercise in wishful thinking. The numbers may look objective, but without careful attention to context, comparability, and the underlying assumptions, we could be fooling ourselves.
In the end, ratios are not a substitute for human judgement supported by logical and transparent reasoning. Ratios are pieces of evidence - sometimes useful, sometimes misleading - that can feed into the complex process of assessing VfM. Use them wisely, with due caution, asking: are we measuring what matters, or creating numbers we can’t interpret?
Acknowledgement
Many thanks to Daniel Wate for peer review. Errors and omissions are my responsibility. This post represents my professional opinion alone and not those of any organisations I work with.
Thoughtful monitoring
It was a pleasure to meet Daniel Ticehurst last week. Check out his Substack article on Thoughtful Monitoring, which “aims to simplify the art of learning and adaptation by using a language understood by normal people”. More thoughtful monitoring goes beyond indicators. It evolves over time as needs change. It is driven by the needs of those who use the information. It generates learning that informs adaptation, and it helps attune monitoring systems to the complexities of the operating environment. Always good to meet a fellow traveller.
Thanks for reading!
In some sectors there are generally accepted benchmarks that indicate sector-specific levels of good performance, such as the World Bank’s International Benchmarking Network for Water and Sanitation Utilities; UNICEF’s Child Well-Being Indicators; and the Public Expenditure and Financial Accountability Framework for public financial management. For instance, the UK Department for Transport has a table for high/medium/low/poor benefit-cost ratios - though their equating these directly with VfM is misleading, as BCRs do not always capture the full range of social and strategic benefits. Some organisations set minimum thresholds for an indicator called Internal Rate of Return (IRR) - defined as the discount rate at which the Net Present Value is zero. IRR thresholds can be used to set a sensible bar to ensure that an investment is expected to generate a reasonable return. Evaluating the IRR against a threshold also avoids the false precision sometimes associated with benefit-cost ratios (such as quoting results like $1.18), and helps discourage inappropriately describing social programs purely in terms of monetary returns.
A common myth is that SROI includes a broader range of benefits than CBA. In reality, social CBA can include any benefits SROI might consider. The key differences come down to decisions about scope and the trade-off between reliability and breadth. A rigorous CBA and a rigorous SROI, with the same scope, should reach similar conclusions.
Another measure, disability-adjusted life years (DALYs) use “disability weights”, standardised by expert panels, for scaling lifespans. This standardisation is useful in cross-country comparisons and burden-of-disease trend analysis.
Ratio: rational, reason, etc. Okay...but maybe there are different kinds... rational and irrational numbers...whole number integers are the basis of sound communication.
Tl;dr as oftentimes...but I will!! Initial thoughts: rational vs. irrational ratios, golden vs average ratios, ratios as resonances in the music of life.